

The Global Matchup: Rice Modeling Around the World
This year’s World Cup has recently wrapped up with a summer filled with camaraderie, cultural exchanges, and outstanding competition. While many may have enjoyed it solely for the sport, we at Waterborne relished this chance to speak with our clients around the world on such an exciting topic. Inevitably, conversations left soccer and turned back to science, our first love, and then to a subject important on almost every continent: growing rice.
Over the years, Waterborne’s scientists have worked diligently to first identify and then minimize rice’s agriculture impact around the world. As one of the few agricultural commodities that purposely discharge drainage to open waters, rice farming requires additional steps to protect aquatic species both within the rice fields (e.g., crawfish aquaculture, migratory birds, etc.) and downstream aquatic ecosystems. Among the best mechanism for evaluating potential adverse effects associated with its growth is rice modeling, and it is through modeling that our scientists are able to design management systems for safer, responsible use of agrochemicals. With this in mind, we hope you’ll join us on a glo(oaaaaalll)bal trek through rice paddies as we look at rice modeling’s evolution.
In yet another tie-in with the World Cup, each one of these rice systems offer special features that can address specific needs. While they may not boast names like Messi and Haaland, make no mistake: these experiences are the superstars of the rice agricultural industry around the world.
Rice agriculture presents a unique problem with respect to agrochemical runoff because of the high seasonal rainfall, water management practices, and proximity of cropland to surface-water bodies typical of rice-growing areas. Therefore, rice models have been developed to predict chemical residues in rice fields. Some rice models are linked to models that can simulate the transport of water and chemical residues from the rice field to a receiving waterbody or simulate groundwater.
Waterborne's Rice Water Quality Model (RICEWQ), developed in 1991, was among the first specialized models to evaluate the dissipation of a chemical in rice agriculture. The model was developed to simulate water and chemical mass balance associated with the unique flooding conditions, overflow, and controlled releases of water that are typical of rice production. The model has been applied worldwide and has been coupled with other models, including our Riverine Water Quality Model (RIVWQ) and USEPA’s Exposure Analysis Modeling System (EXAMS) for predicting surface water concentrations and USEPA’s Vadose Zone Flow and Transport model (VADOFT) and USDA’s HYDRUS model for leaching and groundwater assessments.
PADDY. The PADDY model was developed in Japan during the early 1990’s to assess the safety of pesticides and herbicides used in rice production. The development was in response to detections to specific agrochemicals in river systems in Japan. PADDY was first published in 1999 and enhanced over time with the inclusion of a dedicated root-zone department and to forecast downstream river and stream concentrations of interconnected paddies.
In the US, the Pesticides in Flooded Applications Model (PFAM) was developed by the USEPA to facilitate risk assessment for pesticides used in flooded-agriculture applications (Young, 2013). The model includes fate properties of pesticides and common water management practices associated with flood agriculture. The mathematical formulation of the processes in PFAM were based on the USEPA EXAMS model (Burns, 1997; 2004). The USEPA has set standard rice scenarios to be used with PFAM.
The EXAMS model was developed by the USEPA and was the regulatory waterbody model that was used for risk assessment in the United States. The Variable Volume Water Model (VVWM) has replaced EXAMS in U.S. surface water modeling risk assessments. However, EXAMS is still being used for risk assessments globally such as South America (Andean countries). EXAMS combines a chemical fate and transport model with a steady-state hydraulic model to simulate the following processes: advection, dispersion, dilution, partitioning between water, biota, and sediment, and degradation in water, biota, and sediment (Burns,1997). Model geometry is based on the segment/compartment approach in which the simulated system is divided into a number of discrete volumes that are connected by advective and dispersive fluxes.
MED-Rice (Med-Rice, 2003) is a screening tool used in Europe to assess predicted concentrations in the paddy, canal, and groundwater. The model is a spreadsheet that has two scenarios (clay and sand).
In Japan, the PCPF model is used to predict the fate and transport in/from rice paddies to a river (Watanabe, et al., 2000). This rice field/river scenario is in a spreadsheet model that was established by the Ministry of the Environment. It includes water balance and chemical mass balance. The model has been coupled with USDA’s SWAT model for watershed-wide assessments.
VADOFT is a vadose zone transport model contained with the USEPA PRZM Root Zone Model (PRZM) (Carousel, et al, 2005). PRZM predicts the transport of water and chemical in runoff and leaching from a field. VADOFT estimates the movement of water and chemicals in the vadose zone. The model is used to predict groundwater concentrations.
Waterborne developed the Pond Water Quality Model (PONDWQ) to evaluate the dissipation of agrochemicals in ponds irrigated from a water source containing agrochemical residues due to runoff or drift from use on crops on nearby fields (Williams et al, 2014).
Below, we highlight some of our rice modeling by continent:
Europe
In the EU, RICEWQ has been recommended as a higher-tier rice model to use after the screening model MED-Rice. in 2021, the International Centre for Pesticides and Health Risk Prevention (ICPS) proposed an update/harmonization of rice pesticide risk assessment and revision of the European guidelines. Europe's proposed rice paddy to canal system is based on a Waterborne RICEWQ/RIVWQ study with a simple rice paddy to canal scenario. Prior to and since 2021, large area simulations have been constructed by Waterborne involving rice fields draining from and into other rice fields, canals, streams and rivers for watershed-wide impacts. Other researchers have conducted leaching assessments coupling RICEWQ to VADOFT and HYDRUS.
South America
For rice paddies in South America and, more specifically, the Andean countries, Waterborne developed the Andean Pesticide Exposure Simulation Tool (ANDES). Working in collaboration with the countries’ agencies and CropLife Latin America, we created crop scenarios unique to the farmed region. For example, the Colombia scenarios include banana/plantain, tomato, potato, and coffee in addition to rice, while Peru’s rice scenarios also included asparagus, corn, tomato, avocado, and grape. In ANDES, the wet rice scenarios utilize the RICEWQ model linked to the EXAMS waterbody model.
Asia
With 90% of the world’s rice consumption, it’s no surprise that Asia is also rice’s top growing continent. Because of this, Waterborne’s scientists have been very involved in rice modeling for Asian countries such as China, India, Korea, and Japan. Japan’s studies involve rice modeling using the PCPF rice model linked with RIVWQ.
Working in China was a particularly interesting work, with a fascinating modeling setup that looked at pond aquaculture. Notes and example models from the Wusi State Farm study demonstrate this interesting work:
“With an objective to estimate exposure concentrations of a parent pesticide and metabolites in aquatic environments associated with the product’s use on rice, this modeling study took a slightly different approach. Concentrations of the parent and metabolites were predicted using a receiving waterbody configured to represent a “typical” canal system used for aquaculture irrigation, and predicted concentrations addressed exposure to aquatic nontarget organisms in the canal and pond. We estimated chemical application, dissipation, and discharge from the rice paddies using RICEWQ. Runoff from non-rice areas was predicted with the Pesticide Root Zone Model. Residue dissipation in the receiving water was predicted using t(RIVWQ and PONDWQ was used to predict residues in the aquatic pond.
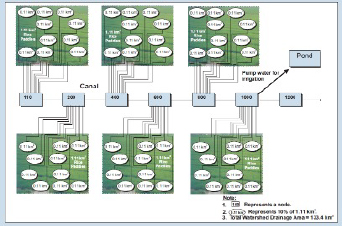
Figure 1. Drainage scenario schematic
A schematic (Figure 1) of drainage scenario is shown in which the paddy water/residue releases to the canal occurred from both drainage and overflow. Canal water was used to irrigation the shrimp pond to maintain a minimum 0.96 m water depth. Irrigation ceased when the pond volume achieved a 1.2 m water depth. Sensitivity scenarios were conducted for the Wusi State Farm watershed that included paddy drainage holding periods of 3, 7, and 25 days after the pesticide application. Simulations were run using 13 years of weather data and typical agronomical practices. Additionally, three simulations were run for each holding period scenario based on different percents of the rice crop in the watershed treated with pesticide: 5%, 25%, and 50%.
The Wusi State Farm modeling study simulated several variations of drainage patterns, canal size, pond size, density of rice treated, overflows and watershed configurations. The figures (Figures 2 and 3) show the results in the variation in the frequency analysis of the annual maximum daily concentration using different holding periods (3, 7, and 25 days) and percent crop treated (5%, 25%, 50%). The conclusion of the study was that irrigating pond with canal water did not results in concentrations in the pond over 0.01 ppb. Therefore, there is sufficient dilution to provide an acceptable margin of safety to aquaculture ponds. As to be expected, the study showed that the longer the water was held in the paddy after application, the lower the concentrations in the canal and pond.
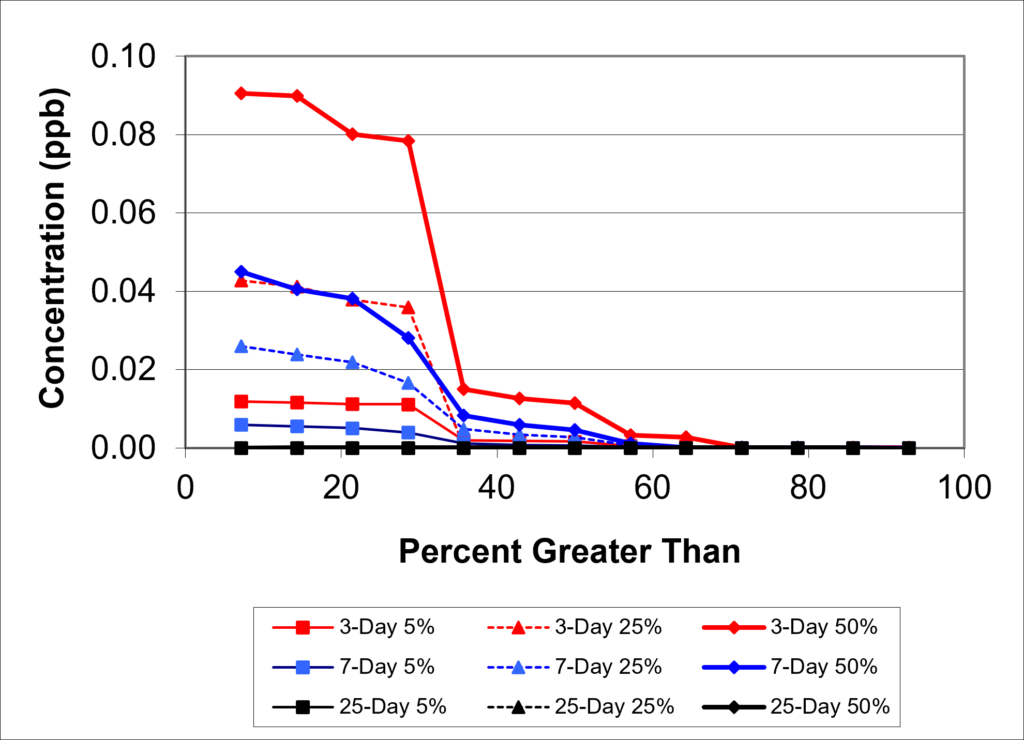
Figure 2. Frequency analysis on the annual maximum daily predicted total residue concentrations in the pond
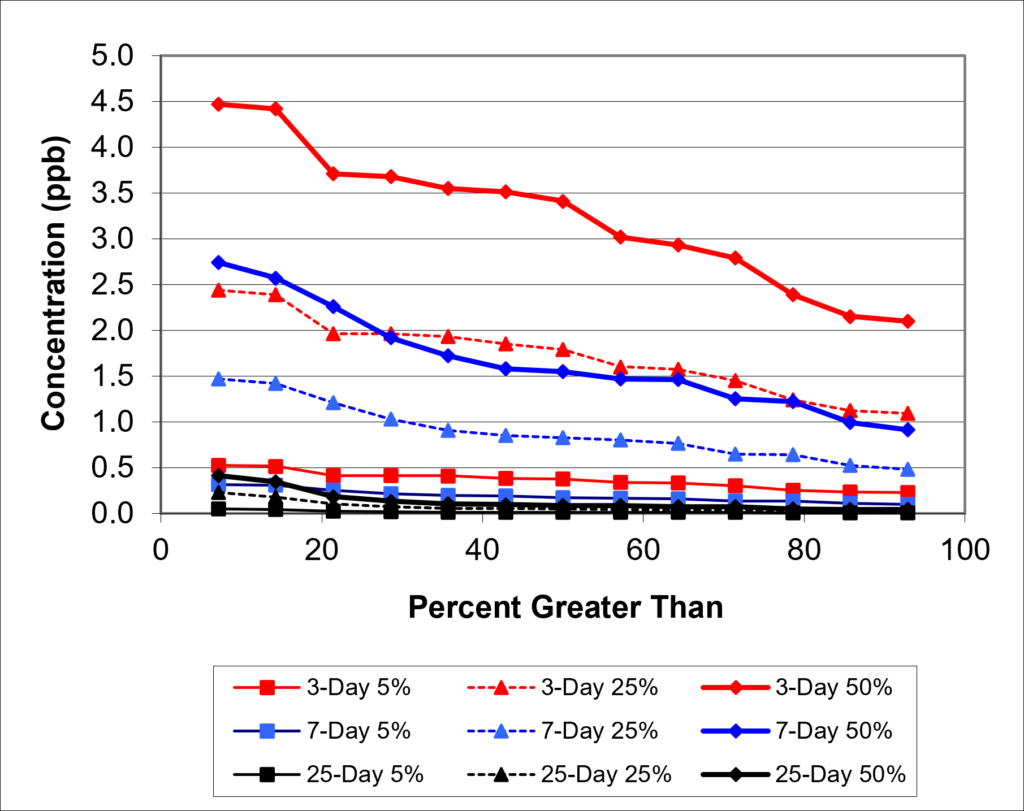
Figure 3. Frequency analysis on the annual maximum daily predicted total residue concentrations in the canal 2000 m downstream
China – PRAESS model
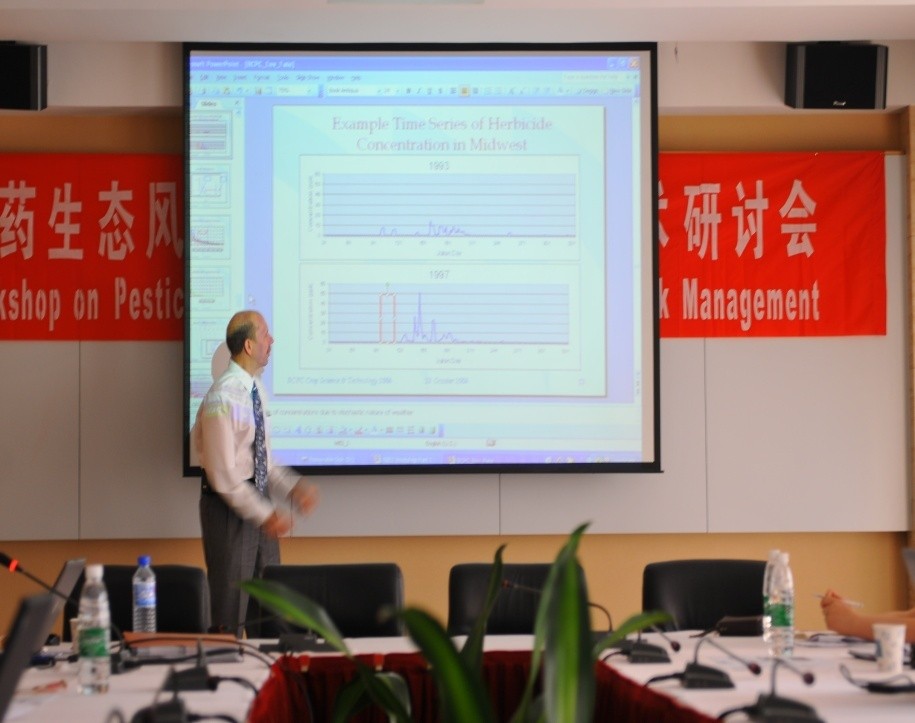
Figure 4. Marty Williams presenting at the NIES
Waterborne collaborated with the Nanjing Institute of Environmental Sciences (NIES) in China (Figure 4) to create RICEWQ scenarios for the Pesticide Risk Assessment Exposure Simulation Shell (PRAESS) that Waterborne developed to predict concentrations in 10 rice growing regions of China (Anhui_Langxi, Fujan_Jianyang, Guangix_Bobai, Hainan_Danzhou, Jiangsu_Changzhou, Jiangsu_Yixing, Jiangxi_Nanchang, Lianoning_Dawa, Zhejiang_Hangzhou, and Zhejiang_Zhuji). NIES is a national scientific research institution directly affiliated with the Ministry of Environmental Protection (MEP) of China. The rice scenarios are modeled with RICEWQ and include single and double annual rice crops with choices of directly seeded or transplanted rice in the rice paddies.
India
A recent rice study in India was conducted running RICEWQ linked to RIVWQ for a large rice growing watershed (3000 1-ha paddies) draining/overflowing into ditches with three levels of canals (primary, secondary and tertiary) increasing in size as the level increased. The total system involved modeling approximately 3500 nodes in RIVWQ. The region had a distinct dry season and wet season and plants/harvests the rice twice a year. The version of RICEWQ that handles a double crop of rice was used in the study. The RIVWQ model was updated for 3500 nodes plus the ability to simulate two suspended sediment concentrations in a year (dry and wet seasons). A sensitivity analysis was performed on variables such as flow, number of applications, percent crop treated, and clusters of treatment. Most years, the highest annual concentration in the tertiary canal was during the wet season. For this study, clustering the treated paddies all in the upgradient block instead of randomly dispersed throughout all the paddies had the most influence on maximum concentration in the tertiary canal compared to the baseline.
North America
Figure 5. Node network for RIVWQ with soils and land use
RICEWQ was an inspiration for the development of a similar model by the U.S. Environmental Protection Agency: the Pesticide in Flooded Applications (PFAM) model. PFAM is used for environmental assessments for regulatory decisions in the U.S. However, it is not conducive to use for research purposes. Therefore, RICEWQ has been adapted for use in different agronomic situations. For example, a crop rotation version of the model was created when we were examining if there may be carryover of a rice product to a second crop such as crawfish or soybeans.
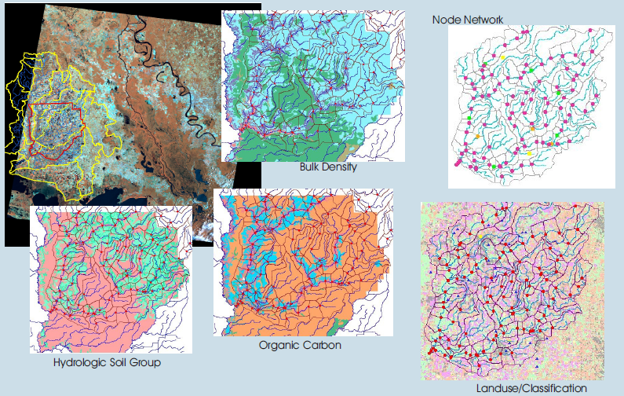
In another US study, RICEWQ was calibrated to several wet seeded rice paddy studies. Then it was linked to RIVWQ to model stream and river results that were compared to USGS or State monitored data in two Louisiana watersheds. GIS was used to overlay the soil properties (bulk density, organic carbon, and hydrologic soil group) with landuse (developed, forest, scrub/brush, arable cropland, and rice) and to determine the nearest weather stations (Figure 5). The runoff from the non-rice areas was modeled with PRZM. The stream geometry (width and depth), velocity, baseflow, base depth, and dispersion coefficients were based on previous Total Maximum Daily Load (TMDL) studies. Assuming that not all farmers plant/harvest at the same time, ten different cropping dates (e.g., planting, harvest) were with water management schedules associated with the planting dates. A percent of rice grown was associated with each pattern.
For this study, the graphs (Figures 6 and 7) show the predicted flows compared to the flow at the USGS gaging station for four years (1992, 1993, 1996, and 2000). The graphed flows show the variation inflow from year to year. The RIVWQ model matched both the low and high flow years fairly well. The State monitored for pesticides approximately weekly for two years and the USGS collected samples monthly. Monitoring data were available for nine sites within the two watersheds. The figures (Figures 6 and 7) are representative of the predictive capabilities of the models. It can be seen that the predicted pesticide concentrations in the waterbodies match the monitored concentrations relatively well.
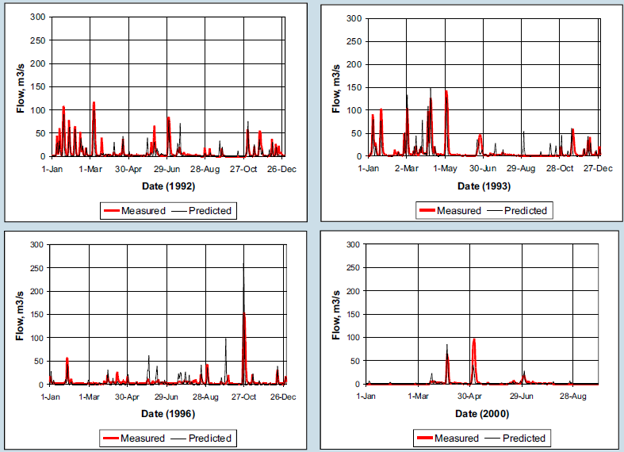
Figure 6. Predicted flow compared to measured Flow at the USGS gaging station in the river
Once the watersheds were validated to actual data, different scenarios were simulated such as substituting planting practices such as dry seeding instead of wet seeding and other application schedules and rates. Probabilistic risk assessments were simulated by running 36 years of weather data. A number of other validation studies have proven that RICEWQ is able to match monitored pesticide concentrations in the paddy. However, from this study, it was concluded that for a watershed with high density of rice production, the use of RICEWQ linked with PRZM and RIVWQ in the prediction of pesticide concentrations in water as well as predicting water flow is a valid option for watershed modeling.
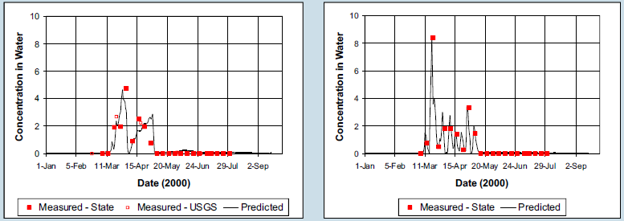
Figure 7. Predicted and measured pesticide in river (left) and stream (right)
References
Burns, Lawrence, 2004. Exposure Analysis Modeling System (EXAMS): User Manual and System Documentation. Version 2.98.04.06: EPA/600/R-00/081. Ecologist, Ecosystems Research Division U.S. Environmental Protection Agency, Athens, GA, pp 206. May 2004 (Revision G).
Burns, Lawrence, 1997. Exposure Analysis Modeling System (EXAMSII): User Guide for Version 2.97.5: Ecosystems Research Division, U.S. Environmental Protection Agency, Athens, GA, 106 pp.
Carousel, R. F., J. C. Imhoff, P.R. Hummel, J.M. Cheplick, A.S. Donigian, Jr., and L.A.Suárez, 2005. PRZM_3, A Model for Predicting Pesticide and Nitrogen Fate in the Crop Root and Unsaturated Soil Zones: Users Manual for Release 3.12.2, National Exposure Research Laboratory, Office of Research and Development, U.S. Environmental Protection Agency, Athens, Georgia.
Inao, K., & Kitamura, Y. , 1999. Pesticide paddy field model (PADDY) for predicting pesticide concentrations in water and soil in paddy fields. Pesticide Science, 55(1), 38-46.
Med-Rice, 2003. Guidance Document for Environmental Risk Assessments of Active Substances used on Rice in the EU for Annex I Inclusion. Document prepared by Working Group on Med-Rice, EU Document Reference SANCO/1090/2000 – rev. 1, Brussels; June, 2003.
Šimůnek, J., M. Šejna, H. Saito, M. Sakai, and M. Th. van Genuchten, 2008. The Hydrus-1D Software Package for Simulating the Movement of Water, Heat, and Multiple Solutes in Variably Saturated Media, Version 4.0, HYDRUS Software Series 3, Department of Environmental Sciences, University of California Riverside, Riverside, California, USA, pp. 315.
Watanabe, H. and K. Takagi, 2000. A Simulation Model for Pesticide Concentrations in Paddy Water and Surface Soil. I. Model Development, Environmental Technology, 21, 1379-1391.
Williams, W.M., J.M. Cheplick, A.M. Ritter, and C.E. Zdinak, 2022. RICEWQ: Pesticide Runoff Model for Rice Crops. Users Manual and Program Documentation: Version 1.92. Waterborne Environmental, Inc., Leesburg, Virginia.
Williams, W.M. and A.M. Ritter, 2014. PONDWQ: Pesticide Runoff Model for Rice Crops. Users Manual and Program Documentation: Version 1.92. Waterborne Environmental, Inc., Leesburg, Virginia.
Williams, W.M., J.M. Cheplick, A.M. Ritter, C.E. O’Flaherty, and P.S. Singh, 2012. RIVWQ Chemical Transport Model for Riverine Environments. User’s Manual and Program Documentation: Version 2.06. Waterborne Environmental, Inc., Leesburg, Virginia.
Young, D., 2013. Pesticides in Flooded Applications Model (PFAM): Conceptualization, Development, Evaluation, and User Guide, OPP, USEPA, EPA-734-R-13-001, July 18, 2013.

Revisions to the Endangered Species Act Redefines “Harm”
Revisions to the Endangered Species Act Redefines “Harm” August 26, 2026 | Endangered Species | On July 7th, the U.S.…
READ MORE
Gulf Hypoxia Action Plan Update
Gulf Hypoxia Action Plan Update August 26, 2026 | Field Studies | Waterborne’s field and data services teams have long supported…
READ MORE
The Global Matchup: Rice Modeling Around the World
No excerpt…
READ MORE

Beyond the Spectacle: The Environmental Effects of Fireworks
Beyond the Spectacle: the Environmental Effects of Fireworks July 21, 2026 | Climate Change | Like shooting stars zooming across…
