PWC3 has been released!

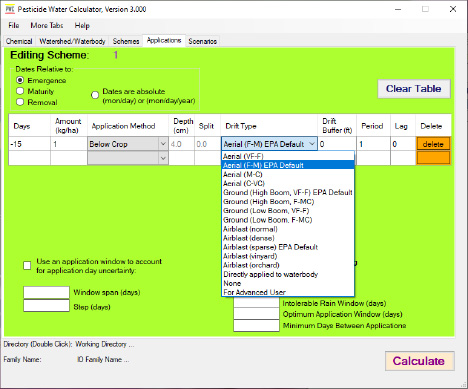
Application tab in PWC3
The anticipation is over. US EPA released their newest version of the Pesticide Water Calculator (PWC v3.0). PWC Version 3 includes some new features and different output of results. Here are some initial observations of PWC3 from some very quick runs:
- As presented in the EMPM meeting, PWC3 now has a “scheme” tab in which the user can select multiple scenarios and an application scheme to go with the selected scenarios (as opposed to a batch file). The new application tab allows the user to choose the drift type and a buffer distance then the model populates the spray drift value for the user for both the pond and reservoir waterbody scenarios (see figure right). If the user wants to see the spray drift values used in their run, the user needs to check the box in the “optional output“ tab.
- Additionally, if the user wants a “.zts” file or old “.csv” file (now “.out” files) with daily values, the user needs to select these as optional outputs. Otherwise, the model default does not produce those output files and only the 90th percentile concentrations are given in a summary.txt file which includes water, pore water, and groundwater concentrations. PWC3 no longer provides graphs in the GUI and doesn’t produce a summary output file with annual maximum exposure duration concentrations.
- Note that the groundwater scenarios and the old ecological scenarios (.scn files) do not work in PWC3 and must be converted to .scn2 files in order to run. Additionally, .dvf weather files are no longer supported in PWC3. From a few preliminary runs, the PWC3 surface water and groundwater concentrations generated are different than the PWC2 results but not significantly.
- A new PWC3 option includes the ability to run the Plant Assessment Tool (PAT), which produces APEZ (pond), WPEZ (wetland), and TPEZ (terrestrial) results. PWC3 does not produce any RQ summary files. From a quick run, the concentrations for APEZ and TPEZ results from PWC3 were similar to PAT (version 2.8). However, the WPEZ concentrations were quite a bit lower from PWC3 than PAT. This was observed from only running one test chemical so the user may not see the same results for other substances.
Waterborne has modelers involved with the CLA Exposure Working Group team to evaluate the new PWC3 model including the PAT tool; therefore, a more in-depth evaluation of the model will be conducted in the near future. We look forward to working with clients and EPA in using these evolving tools in risk assessment support.

Waterborne Environmental, Inc. Hired to Create Online Dashboard That Tracks Nutrient Loss Across the State of Missouri
Waterborne Environmental, Inc. Hired to Create Online Dashboard That Tracks Nutrient Loss Across the State of MissouriJune 27, 2024 |…
READ MORE

Swimming with Bacteria: Water Quality Concerns at the 2024 Paris Olympics
Swimming with Bacteria: Water Quality Concerns at the 2024 Paris OlympicsJune 24, 2024 | all blog | The world is…
READ MORE

The Right Tool – Multidimensional Models
The Right Tool – Multidimensional ModelingJune 24, 2024 | all blog | Marty Williams, Co-Founder The expression “use the right tool…
READ MORE

Celebrating 30-years of Field Studies
Celebrating 30-years of Field StudiesMay 22, 2024 | all blog | Jennifer TraskAs Waterborne concludes its 30-year celebration and begins…


