
30 Years of Exposure Modeling
From PIRANHA through to PWC 2.001, the U.S. Environmental Protection Agency’s approach to exposure modeling for pesticide registration has changed greatly since Waterborne opened its doors 30 years ago. Below we take a look at exposure modeling’s evolution:
Figure 1 shows a timeline of exposure models for ecological and drinking water risk assessments.
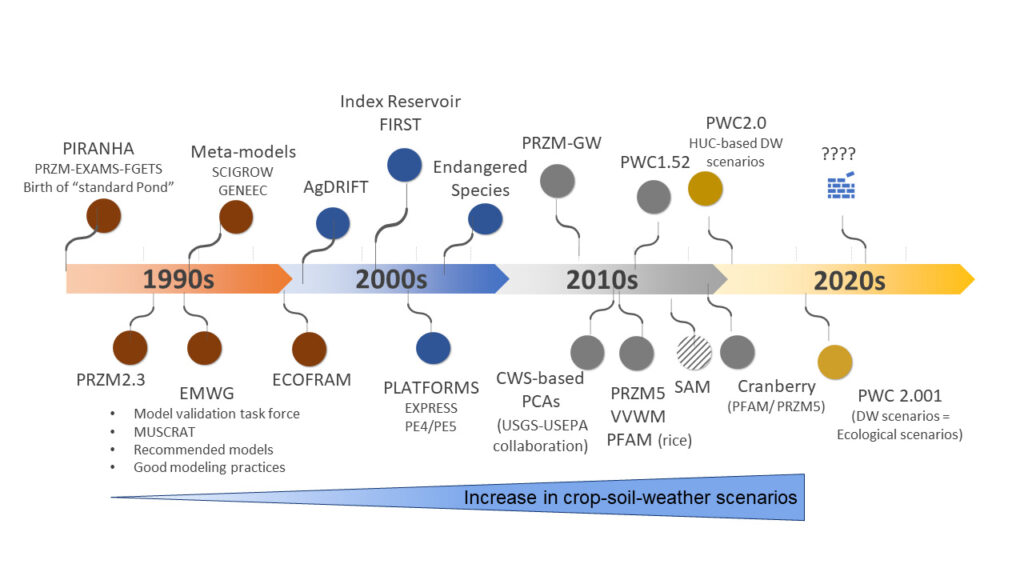
Figure 1. Key Events in EPA’s Aquatic Exposure Assessment
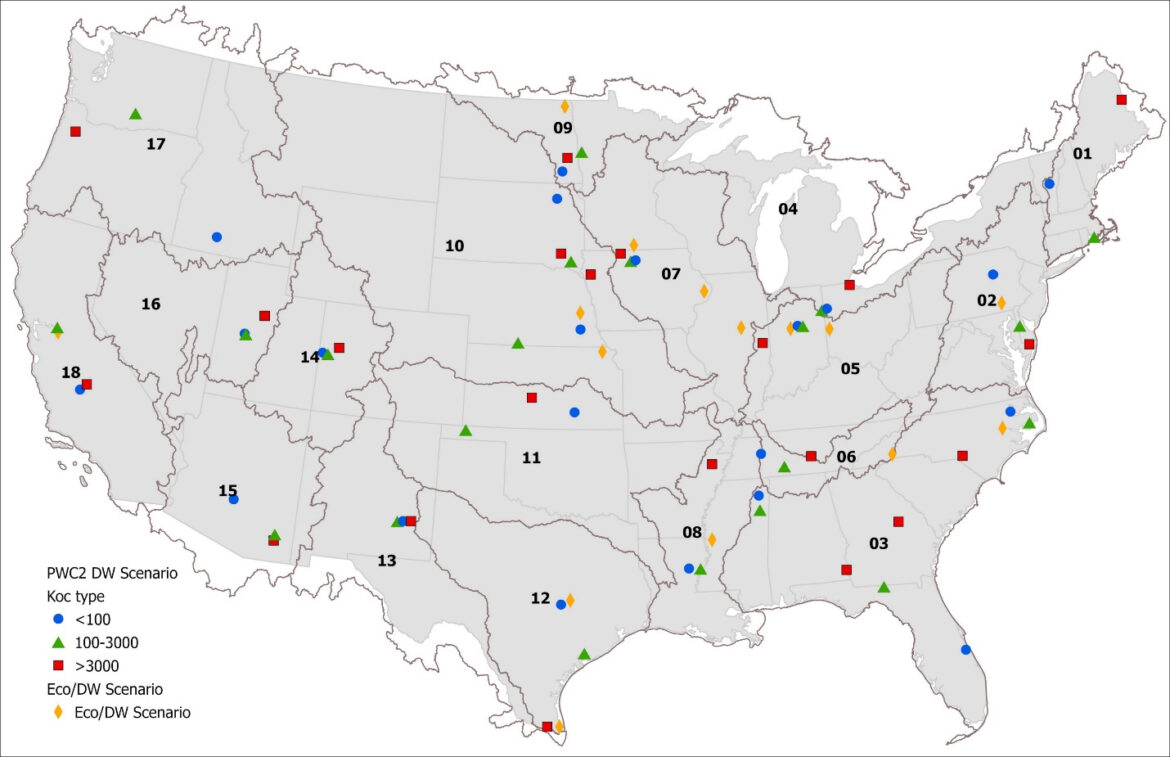
This case study will use a hypothetical pesticide used on corn to demonstrate how the estimated environmental concentrations (EECs) have changed over time with new models and scenarios. The location of surface water corn scenarios are shown in Figure 2. In the figure, the gold diamond are the ecological and drinking water scenarios that were used in the PE5, SWCC, PWC1.52, and PWC2 models. The blue, green and red markers show the location of the PWC2 drinking water scenarios that are now used for ecological scenarios. The inputs for environmental fate are shown in Table 1 and the pesticide application information is in Table 2.
Table 1. Model Inputs – Environmental Fate
|
Parameter |
Value |
Unit |
|
Organic carbon normalized soil adsorption coefficient (Koc) |
10, 1000, 10000 |
L/kg |
|
Aerobic aquatic metabolism half-life |
180 |
day |
|
Anaerobic aquatic metabolism half-life |
180 |
day |
|
Aqueous photolysis half-life |
stable |
day |
|
Hydrolysis half-life |
stable |
day |
|
Aerobic soil metabolism half-life |
180 |
day |
|
Foliar half-life |
stable |
day |
|
Molecular weight |
320 |
g/mol |
|
Vapor pressure |
1.00E-12 |
torr |
|
Water solubility |
70 |
mg/L |
Table 2. Model Inputs – Pesticide Application
|
Parameter |
Value |
Unit |
|
Application Method |
Granular |
|
|
Efficiency |
1.0 |
fraction |
|
Drift |
0.0 |
fraction |
|
Application Rate |
0.1 |
kg/ha |
|
# of Applications |
6 |
|
|
Application Interval |
10 |
day |
|
Application Start Date |
-7 relative to emergence |

Figure 2. Location of Surface Water Scenarios
Figure 3 displays how the acute EECs have changed over time with different models and changes in scenarios. The most recent (2023) ecological scenarios are HUC based so the EECs are compared to the crop scenario that are associated with that HUC. For example, the IACornSTD scenario is in HUC7 so the EECs are compared to the 2023 Corn-r07 scenario. Note that GENEEC, PRZM2, PE5, SWCC models are displaying peak EECs which were used for the acute risk assessment at that time. Starting with PWC1.52 and going forward, EPA changed to using the 1-day EEC for risk assessments. It can be seen from Figure 3 that PRZM 2 had the highest acute EECs and GENEEC consistently had higher EECs especially for low and moderate Kocs. For the PE5, SWCC, and PWC1.52, and PWC2.001 models, the highest maximum acute EECs resulted from the STX and TX corn scenario across all Kocs. For PWC 2.001 2023, the MS corn had the highest 1-day EEC for Kocs of 10 and 1000 mL/g. The NE corn and KS corn scenarios had the highest 1-day EECs for the 10000 mL/g Koc. Actually, the highest EEC was 1.29 ppb which was associated with HUC 3W. A comparison was also made with the chronic 60-day EECs and it had a similar trend. Table 3 shows the maximum 90th percentile EECs across all corn scenarios for each model. Comparing the 1-day EECs from the PWC2.001 corn scenarios to the new HUC scenarios (PWC2.0012023) shows a 58% reduction for the 10 mL/g Koc and 38% for the 10000 mL/g Koc. The 60-day EECs were reduced 49% to 57% across the Koc values.
![]()
Figure 3.Surface Water Acute 90th Percentile EECs
Table 3. Maximum EECs per Koc
| Koc value | |||
| 10 mL/g | 1000 mL/g | 10000 mL/g | |
| Model | Peak or 1-day 90th Percentile EEC (ppb) | ||
| GENEEC (peak) | 26.64 | 10.15 | 2.54 |
| PRZM2 (peak) | 68.95 | 67.46 | 41.14 |
| PE5 (peak) | 18.48 | 10.77 | 4.22 |
| SWCC (peak) | 13.1 | 9.55 | 4.15 |
| PWC 1.52 (1-d) | 13.1 | 9.43 | 3.75 |
| PWC 2.001 (1-d) | 13.07 | 9.17 | 2.09 |
| PWC2.0012023 (1-d) | 5.48 | 4.13 | 1.29 |
| 60-day 90th Percentile EEC (ppb) | |||
| GENEEC | 25.01 | 8.79 | 1.35 |
| PE5 | 16.49 | 8.33 | 1.61 |
| SWCC | 11.4 | 6.67 | 1.24 |
| PWC 1.52 | 11.4 | 6.67 | 1.24 |
| PWC 2.001 | 11.38 | 6.25 | 0.97 |
| PWC2.0012023 | 4.93 | 3.2 | 0.44 |

Beyond the Spectacle: The Environmental Effects of Fireworks
Beyond the Spectacal: the Environmental Effects of Fireworks July 21, 2026 | Climate Change | Like shooting stars zooming across…
READ MORE
When river restoration benefits both native and invasive species
When river restoration benefits both native and invasive species June 23, 2026 | Climate Change | In recent years, removing…
READ MORE
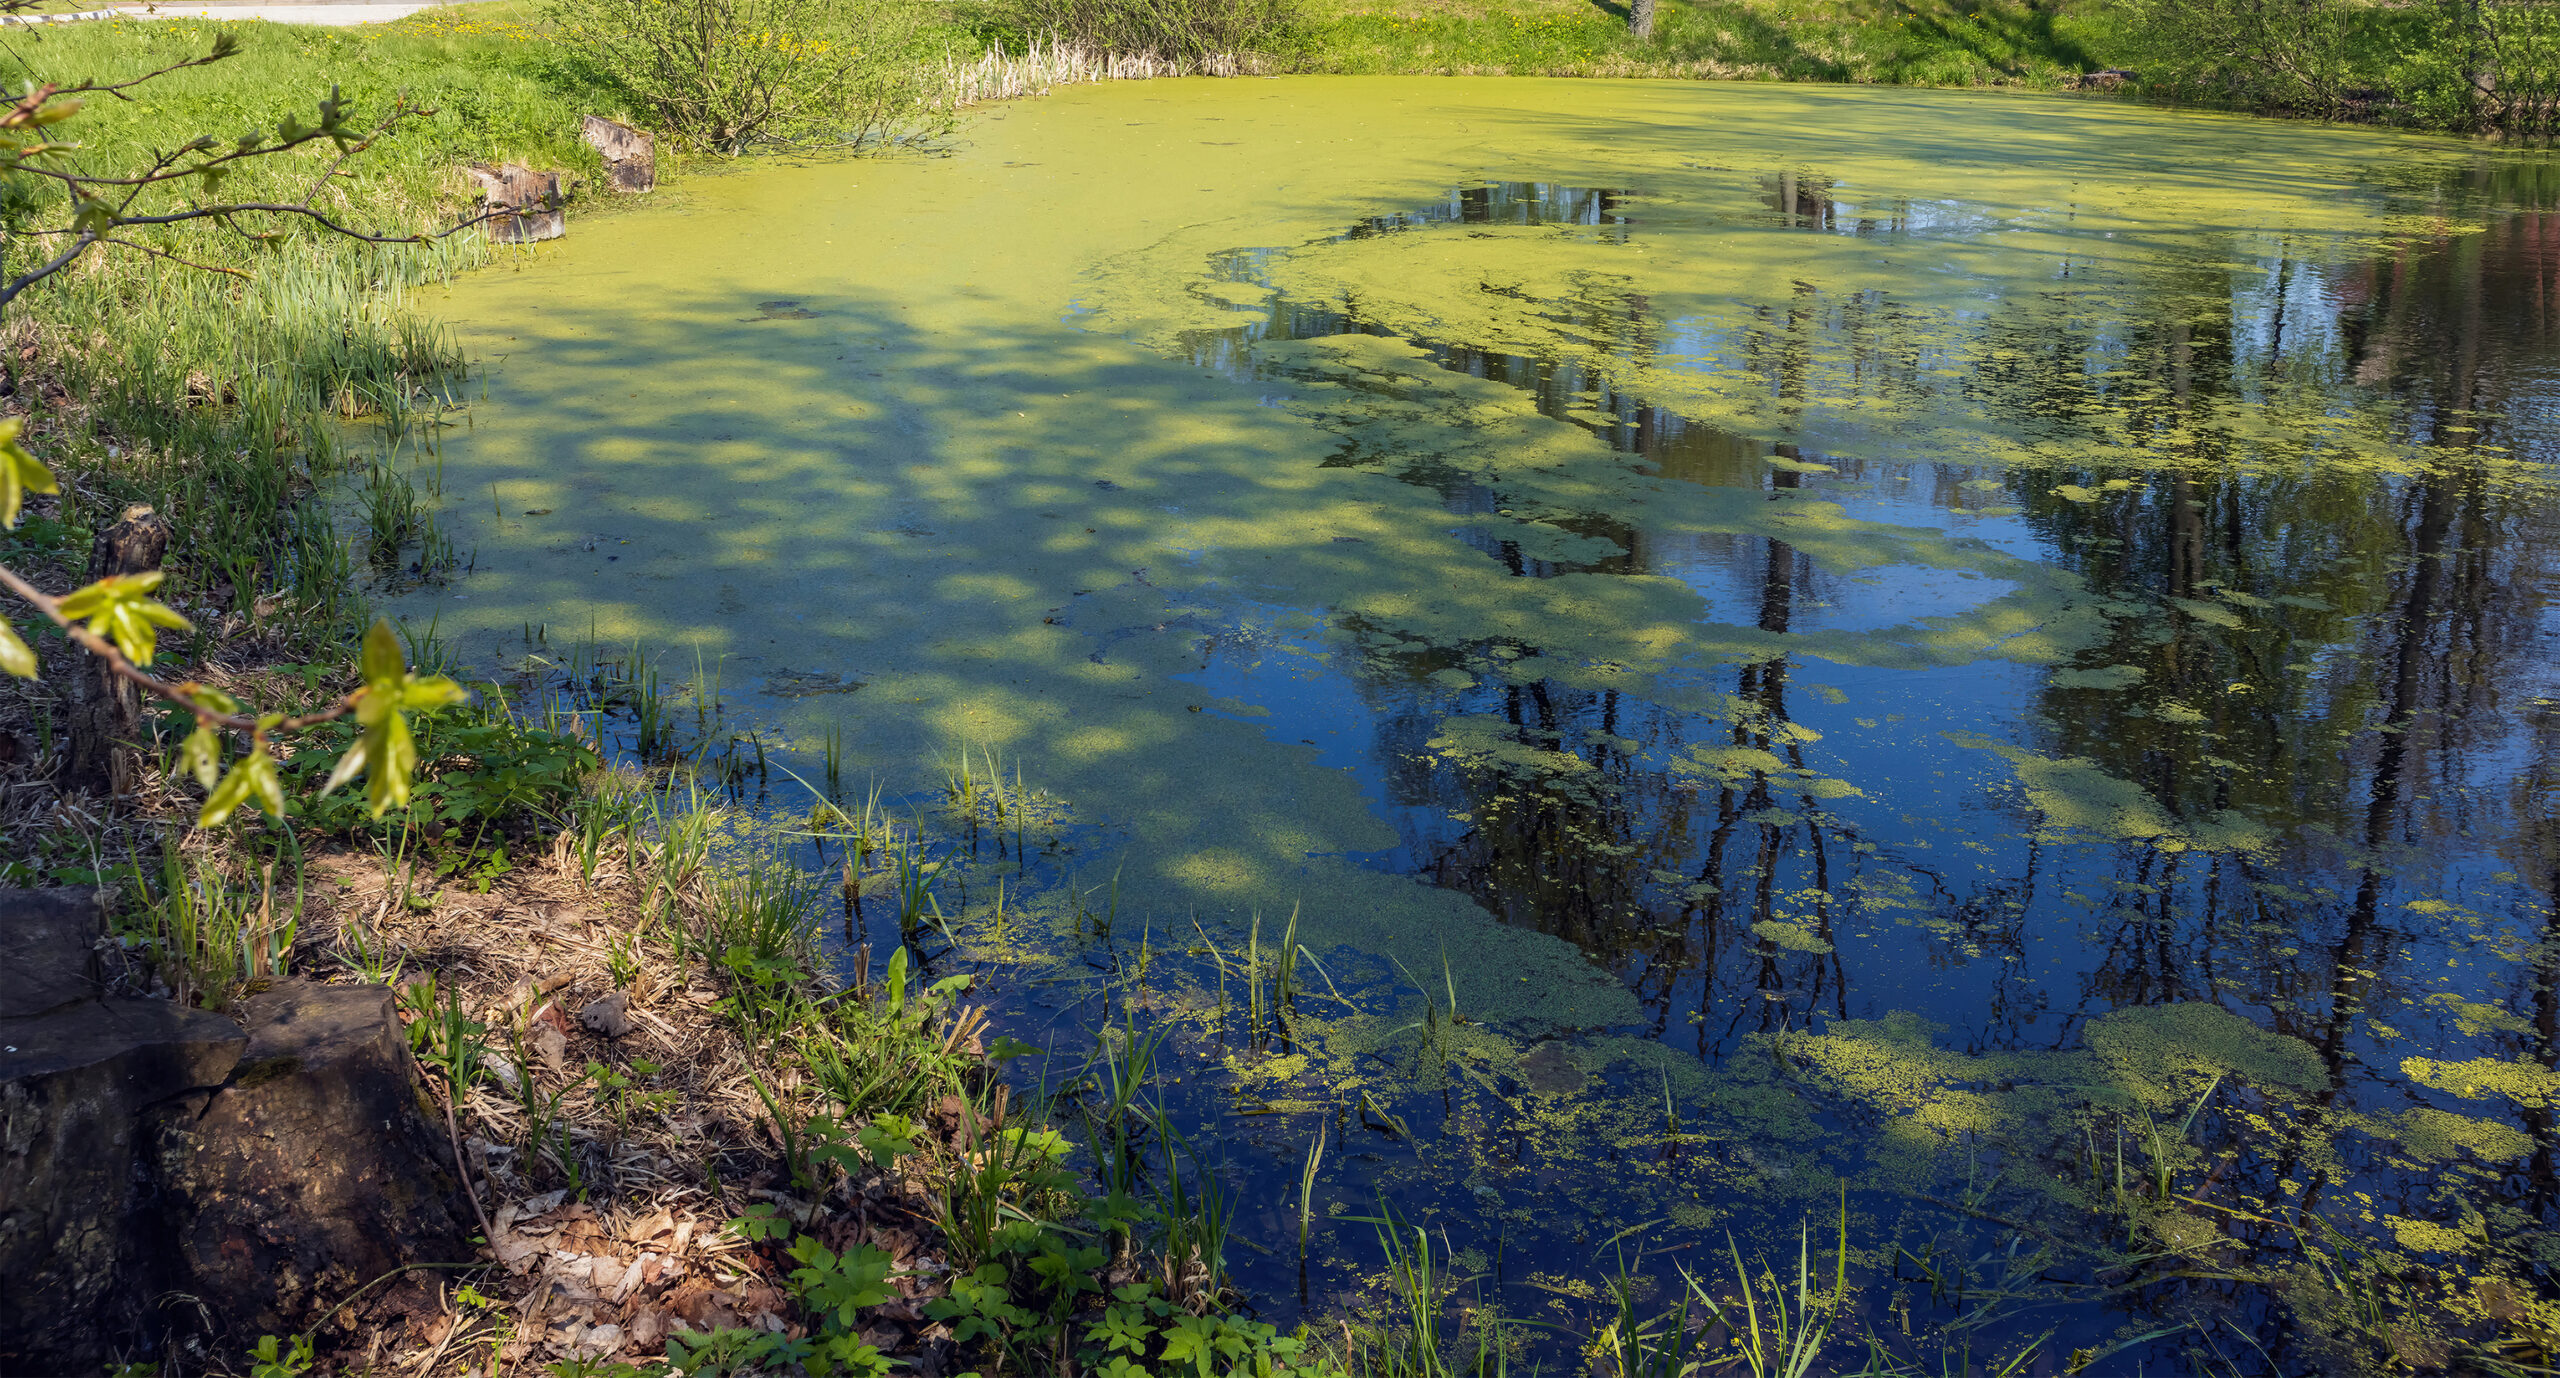
Summer’s Algae Stresses the Importance of Nutrient Monitoring
Summer’s algae stresses the importance of nutrient monitoring. June 23, 2026 | Field Studies | Green. Arguably the color of…
READ MORE
The calm before the storm – welcome to field season!
The calm before the storm – welcome to field season! May 27, 2026 | Field Studies | Jennifer TraskWhile Waterborne…
